
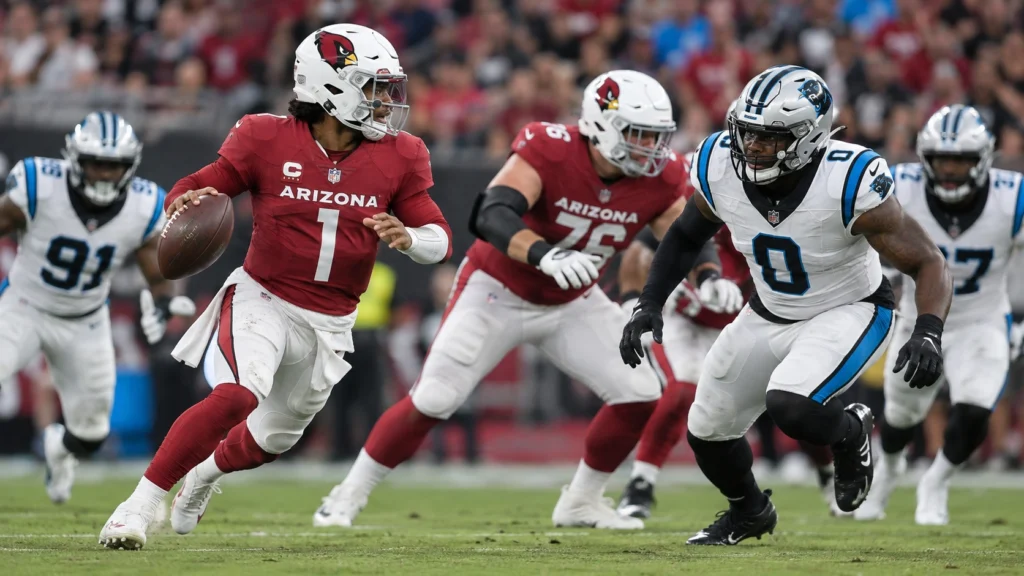
The Arizona Cardinals vs Carolina Panthers match player stats provide a detailed look at how individual players performed in the 2026 Hall of Fame Game. The preseason matchup was played on August 6, 2026, at Tom Benson Hall of Fame Stadium in Canton, Ohio. Carolina defeated Arizona 33–30 in a closely contested game that featured
The Arizona Cardinals vs Carolina Panthers match player stats provide a detailed look at how individual players performed in the 2026 Hall of Fame Game. The preseason matchup was played on August 6, 2026, at Tom Benson Hall of Fame Stadium in Canton, Ohio. Carolina defeated Arizona 33–30 in a closely contested game that featured strong passing performances and several notable individual efforts. The Panthers produced 378 total yards, while the Cardinals finished with 425. Despite Arizona gaining more yards and controlling possession for longer, Carolina made enough key plays to secure the victory.
Arizona Cardinals vs Carolina Panthers: Game Overview
The matchup was an entertaining preseason contest that remained competitive through the fourth quarter. Carolina scored 17 points in the second quarter before Arizona added 10 points in the second half. The Panthers then produced 16 fourth-quarter points to finish the game with 33 points. Arizona responded with 10 points in the final period but could not complete the comeback.
Arizona actually produced more total offense, recording 425 yards compared with Carolina’s 378. The Cardinals also gained 282 passing yards and 143 rushing yards, while Carolina recorded 237 passing yards and 141 rushing yards. Arizona’s 6.5 yards per play was also higher than Carolina’s 5.6, showing that the Cardinals generated more production on a per-play basis.
Carolina Panthers Passing Stats
Haynes King was one of Carolina’s most important contributors. He completed 21 of 34 attempts for 180 yards and two touchdown passes without throwing an interception. His passer rating was listed at 95.2, and he also contributed 39 rushing yards and a rushing touchdown. That combination made King a significant factor in the Panthers’ offensive production.
Kenny Pickett also appeared at quarterback and completed 8 of 11 passes for 62 yards. He did not throw a touchdown or interception and was sacked once for five yards. Together, Carolina’s quarterbacks completed 29 of 45 attempts for 242 gross passing yards, with two passing touchdowns and no interceptions.
Arizona Cardinals Passing Stats
Carson Beck delivered an efficient performance for Arizona. He completed 15 of 19 passes for 188 yards, throwing one touchdown and no interceptions. His 125.4 passer rating was higher than King’s mark, and his 9.9 yards per attempt demonstrated the effectiveness of Arizona’s passing attack when Beck was on the field.
Kedon Slovis also contributed from the quarterback position. He completed 9 of 10 attempts for 106 yards and one touchdown without an interception. Arizona’s quarterbacks combined for 24 completions on 29 attempts, 294 gross passing yards, two touchdowns and zero interceptions. These numbers help explain why Arizona finished with more total yardage despite losing the game.
Rushing Player Stats
The rushing numbers were closely matched between the two teams. Carolina recorded 141 rushing yards, while Arizona produced 143. Miles Davis led the Panthers with four carries for 53 yards, averaging 13.3 yards per attempt. Haynes King added 39 yards on three carries and scored a rushing touchdown, while Dillon also reached the end zone on the ground.
Arizona’s leading rusher was Corey Kiner, who carried the ball 14 times for 57 yards and scored a touchdown. His 4.1-yard average provided consistent production for the Cardinals. Zonovan Knight also contributed to Arizona’s rushing attack, while the team as a whole finished with 143 rushing yards. The balanced production helped Arizona maintain possession for 34:21.
Receiving Player Stats
Jalen Brooks was the standout receiving performer for Arizona. He caught three passes for 99 yards, averaging an impressive 33 yards per reception. His production included a long reception of 49 yards, giving the Cardinals a significant big-play threat through the passing game.
Carolina’s receiving production was spread among several players. Ja’seem Reed caught two passes for 30 yards and scored a touchdown, while the Panthers received contributions from multiple other targets. The team finished with 237 passing yards, showing that its offense was able to move the ball despite Arizona’s stronger overall yardage numbers.
Key Team Statistics
The team statistics provide important context when examining the Arizona Cardinals vs Carolina Panthers match player stats. Arizona had 425 total yards compared with Carolina’s 378, including advantages in both passing and rushing yardage. The Cardinals also possessed the ball for 34:21, almost nine minutes longer than Carolina’s 25:39. For more: Bob Chapek and Diane von Furstenberg: The Connection
However, Carolina converted 9 of 14 third-down attempts, compared with Arizona’s 7 of 12. The Panthers were also perfect on their only fourth-down attempt, while Arizona went 0-for-1. Penalties were another difference: Arizona committed seven penalties for 78 yards, compared with five penalties for only 20 yards by Carolina.
What the Player Stats Show
The individual numbers show that this was not a straightforward game in which the winning team dominated every statistical category. Arizona generated more total yards, had more possession, and produced an especially efficient passing performance from its quarterbacks. Carson Beck’s 188 yards on 15 completions and Jalen Brooks’ 99 receiving yards were among the most notable Cardinals numbers.
Carolina, however, made several important plays that translated into points. Haynes King’s two passing touchdowns and rushing touchdown gave the Panthers a versatile offensive contribution. The team’s strong third-down performance also helped sustain drives. Those details demonstrate why looking beyond the final score can make a player-stat analysis more useful for fans tracking individual performances and preseason development.
Why These Stats Matter
Preseason statistics should be interpreted differently from regular-season numbers because teams often rotate quarterbacks and other players extensively. Coaches use these games to evaluate roster depth, younger players, positional battles, and players competing for larger roles. As a result, a standout performance can provide useful evidence about an individual player’s preparation and ability without necessarily predicting his regular-season workload.
For fans searching for Arizona Cardinals vs Carolina Panthers match player stats, the most useful numbers include quarterback efficiency, rushing attempts, receiving production, turnovers, third-down conversions, and total offensive output. Looking at these categories together provides a more complete picture than simply focusing on the 33–30 final score.
Frequently Asked Questions
Who won the Arizona Cardinals vs Carolina Panthers game?
The Carolina Panthers defeated the Arizona Cardinals 33–30 in the 2026 Hall of Fame Game.
Who was the top Cardinals passer?
Carson Beck completed 15 of 19 passes for 188 yards, one touchdown and no interceptions.
Who led Arizona in rushing?
Corey Kiner led the Cardinals with 14 carries for 57 yards and one touchdown.
Who had the most receiving yards for Arizona?
Jalen Brooks led Arizona with three receptions for 99 yards.
How many total yards did each team have?
Arizona recorded 425 total yards, while Carolina finished with 378 total yards.
Conclusion
The Arizona Cardinals vs Carolina Panthers match player stats show a closely contested preseason game in which Arizona produced more total offense but Carolina made enough important plays to win 33–30. Carson Beck, Corey Kiner, and Jalen Brooks were among Arizona’s notable performers, while Haynes King provided a versatile performance for Carolina with passing and rushing production.
The numbers also show why a complete box-score review is valuable. Passing efficiency, rushing output, receiving production, third-down conversions, penalties, and possession time all contributed to the final result. Fans can use these statistics alongside preseason news and roster updates to follow how individual players develop throughout the season.




















Leave a Comment
Your email address will not be published. Required fields are marked with *